Why is PAR more important than lumens for plant growth? The answer begins with a measurement mismatch. Lumens describe visible brightness for human eyes. Plants respond mainly to photons within the photosynthetically active radiation range, generally 400–700 nanometers. A bright lamp can look impressive while delivering weak usable light to leaves. It can also waste energy outside the wavelengths plants use efficiently.
Dr. Bruce Bugbee, a leading plant scientist and lighting researcher, explains the distinction simply: “Lumens are for humans; PAR is for plants.” His point is practical, not cosmetic. ASABE S640.1-2017 identifies PPFD and related photon-based metrics as suitable for evaluating horticultural lighting. The DesignLights Consortium’s Horticultural Lighting Technical Requirements also emphasizes PPFD, spectrum, and daily light integral rather than visual brightness alone. These standards support what growers see under a canopy: leaf size, internode spacing, and flowering often change when photon delivery changes.
I have made this mistake myself. A lamp looked brighter, yet seedlings stretched beneath it. The missing detail was PPFD at canopy height. Not appearance.
This guide explores seven reasons PAR deserves more attention than lumens. It covers PPFD, DLI, spectrum, measurement distance, and energy efficiency. Some claims need careful context. Crop species, growth stage, leaf angle, and environmental conditions all matter. Lumens are not useless; they are simply the wrong primary language for plant performance. Reliable decisions require a calibrated quantum sensor, repeatable measurements, and honest interpretation of manufacturer data.
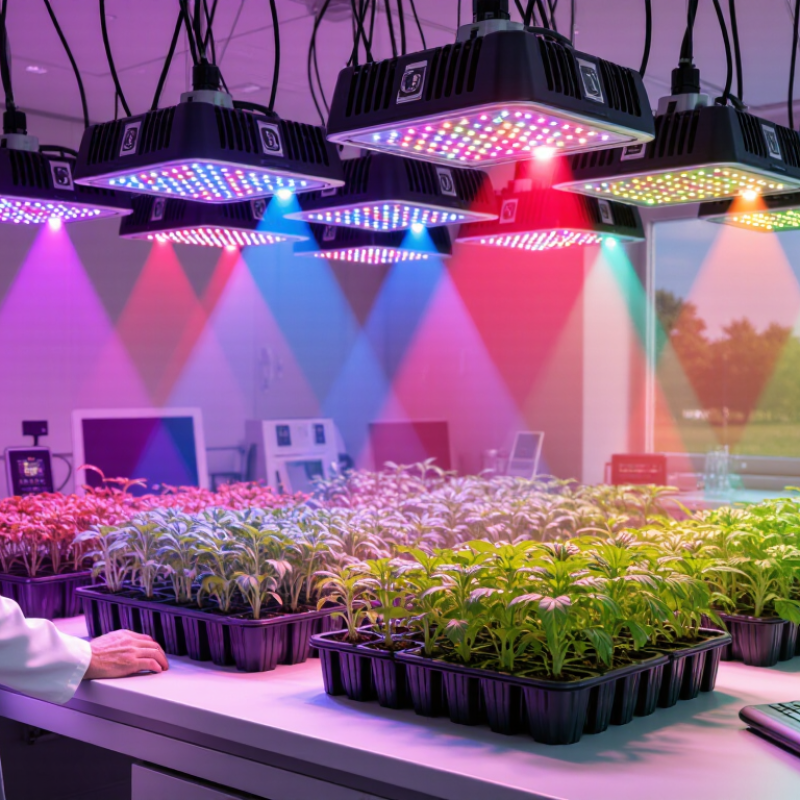
7 Tips Why PAR Matters More Than Lumens for Plant Growth?
What PAR Measures in Plant Lighting
PAR measures light wavelengths from 400 to 700 nanometers. These wavelengths drive photosynthesis in most plants. Lumens measure brightness for human eyes, not plant performance. A lamp can look bright while delivering weak photosynthetic light.
Tip 1: Check PPFD, not only lumens. PPFD shows how many PAR photons reach one square meter each second. Measure it at the leaf level, where plants actually receive light. A seedling may need less intensity than a flowering crop. More is not always better.
Tip 2: Watch the daily light integral, or DLI. DLI combines light intensity and hours of exposure. For example, twelve hours at moderate PPFD may outperform six harsh hours. Plant response depends on both strength and duration. This detail is easy to miss.
Tip 3: Measure across the canopy. Light near the center may be much stronger than light at the edges. Rotate containers when practical. Use a calibrated PAR meter when possible. Smartphone estimates can help, but they are not perfect.
In my own observations, leaves often reveal poor lighting before instruments do. Thin growth, stretched stems, and pale new leaves deserve attention. Still, symptoms can have several causes, including watering or nutrition. PAR provides evidence, not a complete diagnosis. I sometimes adjust intensity too quickly, which can stress plants. Gradual changes are safer.
| Tip | What the Measurement Represents | Typical Unit | Why It Matters for Plants | Practical Use |
|---|---|---|---|---|
| 1. Choose PAR over lumens for plant-light comparisons | PAR refers to photosynthetically active radiation, generally light wavelengths from 400 to 700 nanometers that plants can use for photosynthesis. | nm | It describes the relevant wavelength range for photosynthesis rather than human visual brightness. | Check the spectral range and plant-light performance instead of relying on brightness ratings alone. |
| 2. Use PPFD to evaluate light reaching the canopy | PPFD measures the number of PAR photons arriving at one square meter each second at a specific location. | μmol/m²/s | Plants respond to the quantity of usable photons reaching their leaves, not simply to how bright the light appears to people. | Measure PPFD at leaf level and at several points across the growing area to assess coverage. |
| 3. Consider DLI for the full daily light supply | DLI is the total amount of photosynthetically active light received by a square meter during a 24-hour period. | mol/m²/day | Daily photon quantity combines light intensity and photoperiod, giving a more complete picture than a single brightness reading. | Estimate DLI with: DLI = PPFD × hours of light × 3,600 ÷ 1,000,000. |
| 4. Remember that lumens are weighted for human vision | Lumens measure visible light according to the human eye's sensitivity, which is greatest near 555 nm under photopic vision. | lm | A high-lumen source can appear bright while providing a different quantity or distribution of plant-usable photons. | Use lumens for human visual brightness, but use PPFD and DLI for plant-light evaluation. |
| 5. Evaluate spectrum, not only total output | Spectral distribution shows how light output is spread across different wavelengths within and around the PAR range. | nm and spectral power | Different wavelengths can influence photosynthesis, plant form, flowering responses, and visual assessment of plant health. | Review a spectral distribution chart together with PPFD data rather than judging color by eye. |
| 6. Check uniformity across the growing area | Uniformity compares the variation in PPFD between the center and edges of the illuminated area. | % uniformity or PPFD range | Uneven light can produce inconsistent growth, even when the average PPFD is adequate. | Take measurements in a grid pattern and compare the minimum, maximum, and average PPFD values. |
| 7. Match PPFD and DLI to the crop and growth stage | Plant light requirements vary by species, cultivar, development stage, temperature, water, carbon dioxide, and nutrients. | μmol/m²/s and mol/m²/day | More light is not automatically better; excessive intensity can increase stress, leaf temperature, and water demand. | Adjust intensity and photoperiod gradually, observe plant responses, and keep other growing conditions balanced. |
Lumens measure brightness for human eyes, especially green-yellow light. Plants use photons across a broader range. A bright-looking lamp may provide little useful light.
PAR describes radiation from 400–700 nanometres. This range supports photosynthesis. It is more relevant than visual brightness.
Use PPFD to measure photons reaching the canopy. Use DLI to measure the total daily light amount. These measurements are more useful.
Measure at leaf height, not beside the fixture. Move the lamp only a few centimetres, and readings may change sharply. That mistake is common.
The centre may receive 700 units, while edges receive only 250. A single reading hides dark corners. Plants experience the uneven pattern.
Light intensity and operating hours work together. For example, 500 µmol/m²/s for 16 hours provides about 28.8 mol/m²/day. Longer exposure changes the result.
Not always. Excessive intensity can increase heat stress and photoinhibition. Check leaf temperature, airflow, water, and plant responses.
Blue-rich light may support compact growth. Red light often supports flowering responses. Plant variety can change these effects. Published targets are guides, not promises.
No. Sensor accuracy, spectrum, reflections, leaf movement, and fixture height can affect readings. I once trusted a high lumen figure and ignored uniformity. That was poor judgment.
Record PPFD at several leaf positions. Track DLI, distance, temperature, and weekly growth. Compare new leaves, uneven growth, and stressed edges. The data may still be imperfect.
Understanding why is par more important than lumens for plant growth begins with recognizing what each measurement represents. Lumens describe visible light as perceived by human eyes, while PAR measures the wavelengths of light plants can use for photosynthesis. Because plants respond differently across the 400–700 nanometer range, a bright-looking lamp may not provide the most useful light for healthy growth. PAR data offers a more plant-focused way to evaluate lighting performance.
This guide explains how PAR supports photosynthesis, leaf development, flowering, and overall plant strength. It also clarifies the differences between PAR, PPFD, and lumens: PAR defines the usable light range, PPFD indicates how many usable photons reach a specific area, and lumens measure human visual brightness. By comparing these values, growers can select lighting based on plant needs, coverage, height, and growth stage rather than appearance alone, creating a more informed and effective lighting setup.