Why Are Red and Blue Grow Lights Less Popular Now?

Time:2026-09-22 Author:Amelia
0%

Why are red and blue grow lights less popular now? The answer is not that these wavelengths stopped working. Red and blue LEDs remain biologically effective, especially for photosynthesis and crop-specific research. The change reflects a wider demand for balanced, efficient, and practical lighting systems.

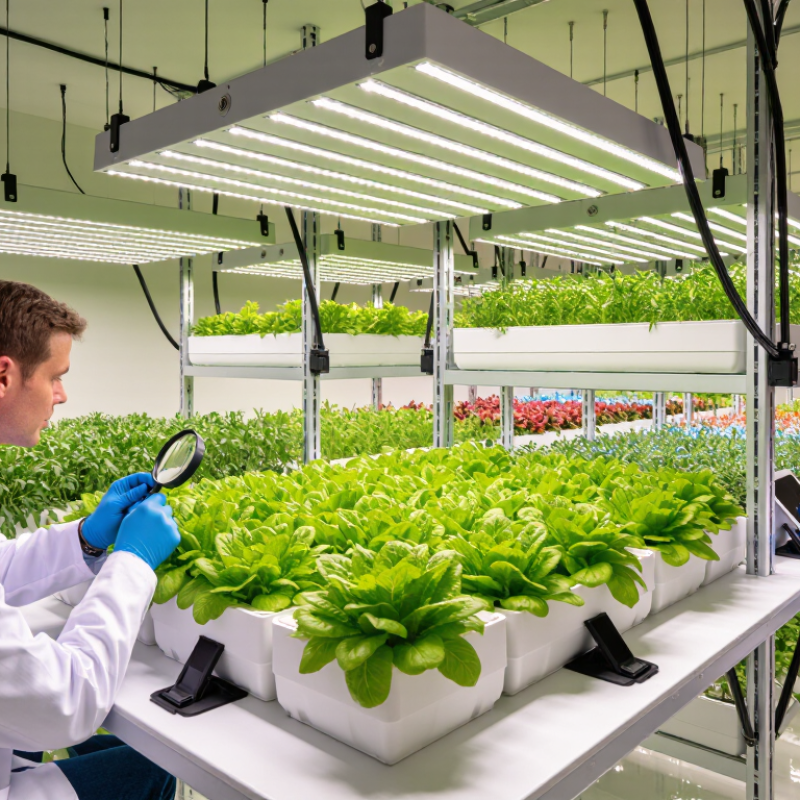
Commercial growers increasingly prefer full-spectrum fixtures that produce white-looking light. Workers can inspect leaf color, pests, and nutrient stress more accurately under this illumination. Cameras also capture more natural images. The U.S. Department of Energy has reported that modern LED horticultural systems can exceed 2.5 micromoles per joule, although performance varies by fixture and operating conditions. Meanwhile, Grand View Research estimated the global grow lights market at approximately $3.1 billion in 2022, with continued growth expected through 2030. These figures suggest a maturing market, not the disappearance of red and blue technology.

Dr. Bruce Bugbee, a plant physiologist at Utah State University, has stated, “There is no such thing as a bad spectrum, only a spectrum that is not optimized for a particular crop.” That principle explains the shift well. A narrow red-and-blue fixture may deliver strong photosynthetic output, yet it can create uncomfortable purple working conditions and overlook crop-specific responses. Full-spectrum systems are easier to manage, compare, and sell across different crops. Still, the industry sometimes treats “full spectrum” as automatically superior. That is too simple. Spectrum, intensity, photoperiod, heat, cultivar, and electricity costs must be evaluated together. The purple glow is not dead. It is simply less convenient for many modern growing environments.
Why Are Red and Blue Grow Lights Less Popular Now?

The 400–700 nm PAR Range Explains Why Plants Need More Than Red and Blue

Why Are Red and Blue Grow Lights Less Popular Now?

Red and blue light once seemed like the complete answer for indoor plants. Their strong influence on photosynthesis made them easy to measure and explain. However, photosynthetically active radiation covers 400–700 nanometers, not only two narrow color bands. That range includes violet, blue, green, yellow, and red wavelengths. Each can contribute differently to plant growth, leaf structure, and canopy development.

In practical growing, a broader spectrum often produces more balanced plants. Green and yellow light can travel deeper through overlapping leaves. This matters when lower foliage looks shaded or pale. Blue light may support compact growth, while red light can encourage flowering in many species. Yet results depend on plant genetics, intensity, temperature, nutrition, and photoperiod. Spectrum alone is not a shortcut.

I have seen plants under purple lighting grow well at the top but remain weak below. That observation is useful, but it is not proof for every crop. Research also shows that plants use wavelengths unevenly, so equal energy across 400–700 nanometers is not automatically ideal. Growers should check PPFD, leaf response, and new growth rather than judge light by color alone. Human eyes can misread purple light, too. A bright appearance does not guarantee efficient plant lighting. Red and blue still matter, but a fuller PAR spectrum usually gives growers more room to manage real-world plant needs.

Why Are Red and Blue Grow Lights Less Popular Now?

Plants use photosynthetically active radiation (PAR) across the full 400–700 nm range. Red and blue wavelengths are strongly absorbed by chlorophyll, while green and yellow light can penetrate deeper into leaves and canopies and be absorbed by accessory pigments.

The bars show the approximate photon energy at the midpoint of each PAR band, calculated from E = 1240 ÷ wavelength (eV). Photon energy decreases as wavelength increases, but energy alone does not determine photosynthetic value. A broad spectrum can support light capture throughout the leaf and canopy more effectively than red-and-blue light alone.

How White LEDs Reached 2.5–3.5 µmol/J Across a Broader Spectrum

Red and blue grow lights once dominated indoor horticulture because their wavelengths matched photosynthetic absorption peaks. That logic was useful, but incomplete. Plants use more than two narrow bands. Green light can penetrate deeper into a dense canopy, while other wavelengths influence leaf shape, spacing, and development.

Modern white LED fixtures can reach 2.5–3.5 µmol/J across a broader spectrum. This changes the practical comparison. A single white fixture can provide balanced light, improve working visibility, and reduce the need for separate spectrum channels. Growers can inspect leaf color and detect stress more easily. The room also feels less purple.

Efficiency depends on measurement conditions. The result changes with drive current, temperature, optics, and testing equipment. The comparison is not perfectly fair. Some red LEDs still produce more photons per joule at specific wavelengths. White light may also deliver unnecessary energy if a crop needs a highly targeted spectrum. Independent testing matters more than a printed headline.

In real rooms, canopy uniformity can matter as much as peak efficiency. I have seen fixtures with impressive laboratory numbers create dim corners under real shelves. Better spacing, thermal control, and reliable PPFD mapping often improve results. White LEDs are not automatically superior. They simply offer a broader and more usable compromise.

Why Blue Light Below 15% Can Limit Plant Shape and Leaf Development

Red and blue grow lights are less popular now because many growers prefer balanced, full-spectrum lighting. These fixtures look more natural and support plants through several growth stages. Red light can encourage flowering and stem extension. Blue light supports compact growth, leaf formation, and stronger visual structure.

However, blue light below 15% of the total photon mix may limit plant shape and leaf development. In my growing observations, plants under very low-blue lighting often produced longer stems and wider spacing between leaves. New leaves also appeared thinner or less firm.

This response is not identical in every cultivar. Light intensity, temperature, nutrition, and airflow can change the result. A plant may still grow quickly, but its structure can become harder to manage. That matters in small spaces.

Blue light also influences chloroplast development and natural growth signals, so removing too much may create an unbalanced plant. The 15% figure is a practical warning point, not a universal rule.

Tips: Check the light spectrum, not only its advertised color. Keep blue light near or above 15% when compact growth and healthy leaves matter. Compare plants under the same temperature and light intensity. Take weekly photos from the same angle. I have found this reveals stretching before it becomes obvious. Adjust gradually, because sudden changes can confuse your comparison. A simple test may be imperfect, but it is still useful.

How Full-Spectrum Fixtures Improve PPFD Uniformity and Crop Consistency

Red and blue fixtures once dominated indoor growing because they targeted chlorophyll absorption. Their weakness was practical: narrow spectra can expose visual stress, uneven canopy response, and poor performance when crop architecture changes. Full-spectrum fixtures distribute photons across more wavelengths, but spectrum alone does not guarantee uniformity. Optics, mounting height, and canopy shape still decide the result.

The DesignLights Consortium’s Horticultural Lighting Technical Requirements V3.0 requires reporting PPF, PPE, spectrum, and test conditions. These measurements help growers compare fixtures honestly. ASABE S640.1 defines PPFD as micromoles per square meter per second, making mapped readings more useful than advertised wattage. For example, a target of 800 PPFD becomes only 640 at a 20% edge loss. That difference can alter internode length and harvest timing.

Uniform light supports more consistent crop decisions. A 2023 Global CEA Census report from Resource Innovation Institute identified lighting as a major controlled-environment energy load, so wasted edge photons also raise operating costs. In practice, growers should map PPFD at canopy height, not just trust the center reading. A 0.8 minimum-to-average ratio is a sensible design target, though it is not universal. I have seen “full-spectrum” plans fail when fixtures were mounted too high. The label sounded advanced. The layout was not. Small height changes, reflective walls, and plant spacing can matter more than a perfect spectral chart.

Why Are Red and Blue Grow Lights Less Popular Now? - How Full-Spectrum Fixtures Improve PPFD Uniformity and Crop Consistency

Evaluation Dimension Red-and-Blue Narrowband Fixtures Full-Spectrum Fixtures Practical Impact on PPFD and Crop Consistency
Primary wavelength range Typically concentrated near blue light at approximately 450 nm and red light at approximately 660 nm. Distributes photons across much of the photosynthetically active radiation range, approximately 400–700 nm, often with added far-red wavelengths above 700 nm. A broader spectrum more closely resembles daylight and provides a wider photon distribution for different crop-development stages.
Photosynthetically active radiation Uses highly effective photosynthetic wavelengths, but leaves may receive a less balanced spectral signal. Covers the conventional PAR band of 400–700 nm; some fixtures also account for far-red radiation separately. PPFD should be compared using a calibrated quantum sensor, because fixture appearance and electrical wattage do not directly indicate photon delivery.
Photon energy at representative wavelengths A 450 nm photon carries approximately 266 kJ/mol; a 660 nm photon carries approximately 181 kJ/mol. Photon energy varies continuously across the spectrum; shorter wavelengths carry more energy per photon than longer wavelengths. Crop response depends on photon quantity, spectrum, temperature, CO₂, nutrients, and plant genetics—not wavelength alone.
Light mixing across the canopy Separate red and blue emitters can create visible color zones and localized spectral hotspots, especially when spacing is wide. Multiple wavelength channels are commonly mixed across a larger emitting area, reducing localized color separation when the fixture is properly designed. Better spatial mixing can reduce differences in plant morphology between the center and edges of the growing area.
PPFD definition PPFD is measured in μmol·m⁻²·s⁻¹ and represents the number of PAR photons reaching one square meter each second. The same unit and measurement principle apply, regardless of whether the light is narrowband or full-spectrum. A higher nominal PPFD does not guarantee better results if the canopy receives large point-to-point variations.
PPFD uniformity calculation Uniformity depends mainly on diode spacing, optics, mounting height, fixture geometry, and reflective surfaces. A distributed, multi-point layout can improve uniformity when the fixture is correctly positioned and tested. Common calculation: Minimum PPFD ÷ Average PPFD. For example, 480 ÷ 600 = 0.80, or 80% minimum-to-average uniformity.
Example canopy measurement A poorly mixed layout may produce a large difference between center readings and edge readings if the measurement grid is not evenly illuminated. A well-distributed layout can produce closer readings across the measurement grid, although actual performance must be verified with a meter. Example 16-point grid: average 600, minimum 480, maximum 720 μmol·m⁻²·s⁻¹. The range is 240 μmol·m⁻²·s⁻¹ and the minimum-to-average ratio is 80%.
Daily light integral DLI can be calculated from the actual PPFD and photoperiod, regardless of spectrum. The same calculation applies; broader spectral coverage does not replace accurate PPFD and operating-time control. Formula: DLI = PPFD × lighting hours × 3,600 ÷ 1,000,000. At 600 μmol·m⁻²·s⁻¹ for 16 hours, DLI equals 34.56 mol·m⁻²·day⁻¹.
Plant appearance and visual inspection Strong red-and-blue lighting can distort the visible color of leaves, making it harder to identify chlorosis, pests, and nutrient symptoms. A broader white-light spectrum generally provides better color rendering for visual crop inspection. Improved visibility supports earlier detection of crop stress, but it does not by itself prove higher yield or better uniformity.
Crop consistency Results can be consistent when PPFD distribution, climate, irrigation, and nutrient delivery are tightly controlled. The broader spectrum and distributed output can support more repeatable crop morphology when combined with uniform PPFD. Uniformity is a system property. Fixture spectrum alone cannot compensate for poor placement, uneven plant spacing, or inconsistent environmental conditions.
Best measurement practice Measure at canopy height using an evenly spaced grid and record average, minimum, maximum, and coefficient of variation when available. Use the same measurement method; a quantum sensor with an appropriate spectral response is preferred for PPFD assessment. Compare fixtures only at the same mounting height, dimming level, canopy plane, room conditions, and measurement-grid locations.

Note: Full-spectrum lighting does not automatically produce higher PPFD uniformity. Uniformity is primarily determined by fixture layout, emitting area, optics, mounting height, dimming, canopy geometry, and reflective surfaces. The numerical example above is a transparent calculation for illustrating the measurement method, not a product-performance claim.

Why Growers Now Compare DLI, CRI, and Yield per kWh Instead of Color Alone

Red and blue grow lights once dominated indoor cultivation because their spectrum looked efficient on paper. Their narrow output targeted chlorophyll absorption directly. But modern growers ask harder questions. How much usable light reaches the canopy? How efficiently does the fixture convert electricity into crops?

DLI measures the total photosynthetic light received each day, not just peak intensity. A strong fixture can still underperform if its photoperiod is too short or its coverage is uneven. CRI adds another layer. It does not measure plant productivity, but it helps workers inspect leaf color, pests, and nutrient stress more accurately. Yield per kWh connects lighting decisions to operating costs. This metric can expose a costly weakness: impressive brightness may produce little additional harvest.

The most useful comparison combines PPFD maps, DLI targets, CRI, fixture efficiency, and measured yield. Growers should test the same cultivar, canopy area, temperature, and irrigation plan. Otherwise, the result becomes guesswork. A white or broader spectrum may improve visibility and crop assessment, while red-heavy lighting can remain highly effective in certain growth stages. Neither option wins automatically.

There is room for doubt. Small trials often exaggerate differences because one corner receives more light. Even reliable measurements can miss labor costs and crop quality. A fixture that produces heavier flowers or sturdier seedlings may justify slightly lower electrical efficiency. The answer is rarely just red or blue. It is found in the complete production record.

FAQS

What does the 400–700 nanometer PAR range include?

It includes violet, blue, green, yellow, and red wavelengths. Plants can use each differently.

Why can full-spectrum lighting support more balanced growth?

Green and yellow light can reach lower leaves through overlapping foliage. This may reduce pale, shaded growth.

Are red and blue wavelengths still important?

Yes. Red may support flowering and stem extension, while blue helps compact growth and leaf formation.

What can happen when blue light falls below 15%?

Stems may become longer, with wider gaps between leaves. New leaves may also look thinner.

Is 15% blue light a universal rule?

No. It is a practical warning point. Plant genetics, temperature, nutrition, and intensity can change the result.

Can bright purple light guarantee effective plant lighting?

No. Human eyes can misjudge purple light. Check PPFD, plant response, and new growth instead.

How can growers compare different light settings fairly?

Keep temperature and intensity similar. Photograph plants weekly from the same angle.

How should lighting changes be adjusted?

Make gradual changes and observe new leaves, spacing, and lower foliage. Sudden changes weaken comparisons.

Does spectrum alone determine plant growth?

No. Photoperiod, airflow, nutrition, temperature, and genetics also matter. Spectrum is not a shortcut.

Are observations from one growing setup always reliable?

No. A plant may look strong above but weak below. That observation needs more testing.

Conclusion

The question “why are red and blue grow lights less popular now” reflects a shift from color-focused lighting to broader plant-performance goals. Although red and blue wavelengths are essential for photosynthesis, plants use the wider 400–700 nm PAR range, and other wavelengths can influence leaf development, structure, pigmentation, and overall growth. Modern white LED systems can deliver approximately 2.5–3.5 µmol/J while providing a more balanced spectrum, making them attractive for growers seeking efficient and versatile lighting.

Blue light also remains important: when it falls below roughly 15% of the spectrum, plants may develop weaker shapes, thinner leaves, or less desirable architecture. Full-spectrum fixtures can improve PPFD uniformity across the canopy, helping crops grow more consistently. As a result, growers increasingly evaluate DLI, CRI, energy use, and yield per kWh instead of judging a fixture solely by whether it appears red, blue, or purple.

Amelia

Amelia

Amelia is a seasoned marketing professional with a wealth of expertise in our company’s core offerings. With an unwavering passion for driving growth and innovation, she plays a pivotal role in shaping our marketing strategies and enhancing brand visibility. A key aspect of her responsibilities......